Ohio governor touts labor numbers, but what’s the rest of the story?
By Maggie Thurber | for Ohio Watchdog
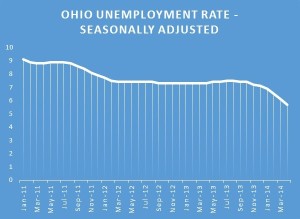
DROPPING: Ohio’s unemployment rate has steadily dropped since January 2011 to 5.7 percent in April – but is it really the best way to judge the health of the state’s labor market?
Open the flood gates.
Ohio announced a 5.7 percent unemployment rate for April, and the media releases flowed.
“(S)ince January 2011, the number of unemployed Ohioans has decreased by 131,000 or 25 percent.” Gov. John Kasich proclaimed. “(Y)ear over year, Ohio’s labor force has grown while the national labor force has shrunk.”
Ohio Democratic Party Chairman Chris Redfern sees it differently: The labor force is shrinking.
“Over the last two months, 25,000 frustrated unemployed Ohioans have given up hope finding a job in Ohio,” he said.
The numbers are easy to manipulate — increase or decrease the number of people counted in the workforce and the unemployment rate goes up … or down.
The last time Ohio’s unemployment rate was 5.7 percent was January 2008, before the recession. Some 5,945,000 people were in the workforce, and some 5,608,000 people were working.
About 5,413,000 people were reported working last month, nearly 200,000 fewer when compared to 2008. Because fewer people were in the workforce, however, the percentage of unemployed people was the same.
How can a state have fewer people employed but the same unemployment rate? Fewer residents?
Not according to the Census Bureau. Ohio’s 2008 population was 11,364,143, and it’s grown steadily to 11,570,808 in 2013.
So Ohio gained 206,665 people between 2008 and 2013, but its labor force shrank by roughly the same number.
All states and the federal government calculate unemployment the same way, which is why some decry the reporting.
The unemployment rate from the Bureau of Labor Statistics is called a U-3 ratio. It’s a bit complicated, but it goes like this:
Beginning in February 1996, BLS began including a range of unemployment measures in its reporting. The new designations are from U-1 — the most restrictive measure counting only people who have been unemployed for at least 15 weeks — to the least restrictive U-6.
Some say U-6 is the more realistic number and a better reflection of the health of the labor market because it counts people without jobs, people who want to work but haven’t due to temporary issues, discouraged workers who stopped looking and people who have jobs but aren’t working as many hours as they want.
Ohio’s U-6 was 13.1 percent for the second quarter of 2013 through the first quarter of 2014. The state’s average U-6 for 2008 was 11.4 percent. It jumped to 17.2 percent in 2009, but it has declined since.
PRIME-AGED: The Economic Policy Institute says that comparing the employment to population of individuals aged 25-54 gives a better picture of the health of the labor market than the traditional monthly unemployment number.
Hilary Wehing, a senior research assistant at the Economic Policy Institute, says the U-6 measurement is good yet has an even better gauge — the ratio of employment to population of prime-aged workers.
EPI is a think tank that focuses on the economic condition of low- and middle-income Americans and their families.It routinely tracks employment data for states and the nation.
“The unemployment rate does matter,” Wehing said. “But we’re in a funny, depressing recovery that’s been going on for five years. Because prospects haven’t been good, we need another measure to understand the health of the labor market because it’s not rebounding in a way that we were hoping for. It’s taking longer than any of our past recoveries.”
EPI’s measurement compares the number of people, ages 25 to 54, who are working to the population of individuals in that age range. Wehing explained that baby boomers who are retiring and young adults who might still be in school are not counted because they are traditionally “less attached” to the workforce, while workers in the 25 to 54 range tend to be the most attached — and more stable — in their employment. She said this measurement gives a better comparison month to month and year to year.
Nationally, prime-aged workers were employed at rate of 76.5 percent in April, a decrease from the 2007 average high of 80 percent.
Ohio’s peak employment for prime-aged workers in 2007 was nearly 81 percent. The 2013 average was 75.1 percent.
The state had a steeper drop than the country but recovered slightly from its low of 74.7 percent in the 2010-11 timeframe, Wehing said.
As for the competing claims from the Republican governor and the opposing Democrats, neither is completely accurate.
Kasich was wrong when he said the number of unemployed dropped by 131,000 since January 2011. It’s actually fallen by 199,000. But Ohio’s labor force has not grown since he took office. It declined from 5,806,000 in January 2011 to 5,741,000 in April 2014, both numbers a far cry from the peak of 5,968,000 in December 2006.
The Ohio Democratic Party was only partially correct in its spin.While workforce numbers fell by 24,000, there’s nothing to say those people left the count because they gave up looking for work — new retirees, students, women who leave to raise their children and people who join the military are not counted in the workforce number.
But it was correct in assuming the decline in employment rate isn’t due just to job gains.
Wehing warned that people and policy makers who pay attention only to the traditional unemployment rate are missing an important aspect of the labor market. Without the additional data on those not counted, people are getting a skewed view of the overall health of the labor market, she said.
“The decline in labor force participation is one of the most serious declines we’ve seen in decades,” Wehing said. “People should be concerned, no matter what the unemployment rate is.”
Contact Maggie Thurber at maggie@ohiowatchdog.org.