North Dakota Senate Mid-Session Legislative Vote Ranking

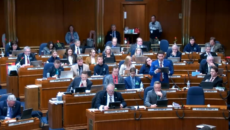
Yesterday we published a ranking of North Dakota House members based on what we considered to be key votes from the first half of the session. Today we’re publishing the Senate version of that ranking.
What you’ll notice, right off the bat, is that the House is a lot more conservative than the Senate. That mirrors the federal level, but what’s odd is that unlike the federal level House members and Senate members all have the same constituencies. Senators from a particular district serve the exact same constituency their House colleagues do. Yet, clearly, a lot of them have very different priorities.
Though, to be fair, we’re only at the halfway point. The Senate considers a lot fewer bills than the House does, and when the Senators begin to vote on the bills the House has sent them you’ll likely see these rankings change quite a bit. Frankly, most of the good ideas seem to come out of the House.
My theory is that we’ll see some drops in the House rankings, and improvements in the Senate rankings, but we’ll see. For now, this is what the first half of the session looked like. But what’s more interesting than the letter grade any individual Senator received was the overall voting trends by party affiliation.
The two most liberal state Senators in the first half were both Republicans. Three members of the Republican caucus voted more liberally than Sen. Mac Schneider, the leader of the Democrat caucus. That’s startling.
We’re not laying any claim to perfection here. Some of these bills represent complicated issues, and legislators often have very complicated reasons for why they voted for or against them. Our intent is to provide a snapshot of how these legislators voted in the aggregate which we hope will serve a lead-in to conversations between you readers and your legislators. Please, don’t judge your legislators based only on this list. Reach out to them (their contact info is here). Talk with them. Find out why they voted the way they did, then make up your mind. And remember that the legislative session isn’t over yet. This is just a summary of how these elected leaders have governed so far.
The full results of our vote ranking including the bills we used to rank them on is included in a spreadsheet below as well as a best-to-worst listing complete with letter grades (Democrat legislators are italicized). If you need to figure out who your legislators are, click here.
Grade A
None
Grade B
None
Grade C
Sen. Joe Miller – 73.91%
Sen. Ron Carlisle – 70.83%
Sen. Jerry Klein – 70.83%
Grade D
Sen. Dwight Cook – 66.67%
Sen. Dick Dever – 66.67
Sen. Ralph Kilzer – 62.5%
Sen. Gary A. Lee – 62.5%
Sen. Margaret Sitte – 62.5%
Sen. Oley Larson – 62.5%
Sen. Donald Schaible – 62.5%
Grade F
Sen. Terry Wanzek – 59.09%
Sen. John Andrist – 58.33%
Sen. Lonnie Laffen – 58.33%
Sen. Larry Luick – 58.33%
Sen. Spencer Berry – 58.33%
Sen. Bill Bowman – 58.33%
Sen. Nicole Poolman – 58.33%
Sen. Jessica Unruh – 58.33%
Sen. Robert Eberle – 54.17%
Sen. Rich Wardner – 54.17%
Sen. Randall Burckhard – 52.17%
Sen. Tom Campbell – 52.17%
Sen. Howard Anderson – 50.00%
Sen. David Hogue – 50.00%
Sen. Kelly Armstrong – 50.00%
Sen. Ronald Sorvaag – 45.83%
Sen. David O’Connell – 45.83%
Sen. Jim Dotzenrod – 41.67%
Sen. John Grabinger – 41.67%
Sen. Joan Heckaman – 41.67%
Sen. Tim Flakoll – 37.5%
Sen. Larry Robinson – 37.5%
Sen. Tim Mathern – 36.36%
Sen. Connie Triplett – 34.78%
Sen. John Warner – 34.78%
Sen. Tony Grindberg – 34.78%
Sen. Carolyn Nelson – 34.78%
Sen. Tyler Axness – 33.33%
Sen. Stan Lyson – 33.33%
Sen. Richard Marcellais – 33.33%
Sen. Dave Oehlke – 33.33%
Sen. Mac Schneider – 33.33%
Sen. Phil Murphy – 33.33%
Sen. Karen Krebsbach – 30.43%
Sen. George Sinner – 29.17%
Sen. Ray Holmberg – 25.00%
Sen. Judy Lee – 25.00%