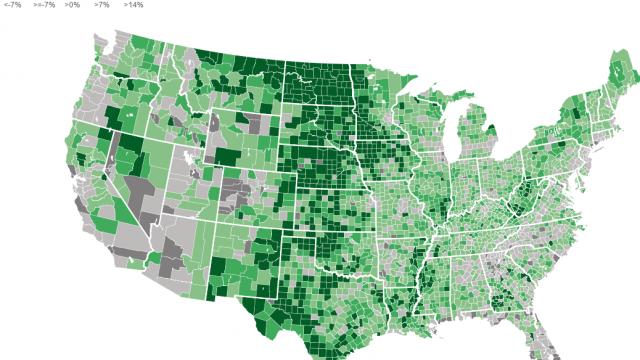
Map: From 2007 To 2012 Every Single North Dakota County Saw At Least 14 Percent Personal Income Growth
The map above is a screen shot of this interactive map posted by Governing.com.
It’s a fascinating image.
What it illustrates is national per-capita personal income growth by county from 2007 to 2012. As you can see, every single county in North Dakota is a dark green indicating more than 14 percent growth. In reality, many counties grew much faster.
The slowest growth was in Ramsey and Grand Forks counties at just under 16 percent. Most counties are in the 30 – 60 percent range. The fastest rate of growth was 165.9 percent in Dunn County which, as you might expect, is right in the heart of the oil boom.
Of course, impacting these growth rate are the baselines where the counties started. Rural, western North Dakota counties started with much lower personal income levels, and so a smaller level of income growth results in a bigger percentage increase.
But still, this sort of growth across the state is truly startling to observe, and it’s not all oil. If you look at where most of the green counties are nationally, they’re in areas that are strong in agriculture and/or energy.